From the CTO’s Desk – December 2025: Stablecoin Contamination Monitoring and Depegging Risk
Executive Summary
As stablecoin adoption continues to scale, secondary-market risk has become a central concern for issuers, exchanges, and regulators. In response, Webacy has expanded its stablecoin risk coverage with two complementary capabilities: a stablecoin contamination detection system and a depegging risk monitor. For this analysis, we partnered with Allium and Dune to compile and examine a universe of approximately 1,000 stablecoin contracts across major EVM chains.
Stablecoin contamination refers to the presence of counterparties exhibiting elevated risk signals or sanctions exposure within a token’s holder base. Rather than treating all exposure uniformly, we measure contamination along two complementary dimensions:
- Contaminated address %: the share of analyzed holders that breach defined risk thresholds.
- Contaminated supply %: the share of circulating supply held by those risky holders.
This dual perspective is critical. A token may have relatively few risky holders, yet still face material exposure if those holders control a large portion of the circulating supply.
Our findings show that contamination is multi-dimensional. While sanctions and mixer adjacency remain important signals, much of the observed risk across stablecoin ecosystems is driven by automated trading clusters, phishing activity, and concentrated risky supply, dynamics that can amplify liquidity stress and increase depegging risk even in the absence of explicit policy violations.
Why Contamination Matters
Compliance Exposure
Adjacency to OFAC-sanctioned entities, exploit-linked wallets, mixers, or drainer ecosystems introduces regulatory, operational, and reputational risk for stablecoin issuers, exchanges, and liquidity providers. Even limited exposure can create compliance friction and downstream operational constraints.
Liquidity Fragmentation
Tainted counterparties and liquidity pools shrink the set of venues considered “clean” or safe to interact with. During stress events, this fragmentation can materially impair usable liquidity, weakening price stability and redemption mechanics.
Depegging Risk Amplification: Concentration and Automation Under Stress
When stablecoin supply becomes concentrated among high-risk, automated, or tightly coordinated holder clusters, market shocks can propagate much more quickly. If a large share of supply is controlled by bots, market-making contracts, or closely coupled strategies, negative signals such as price deviations, liquidity withdrawals, or external shocks trigger simultaneous, automated selling or redemption behavior. This coordinated response accelerates sell pressure and can rapidly overwhelm available liquidity. At the same time, contamination-driven liquidity fragmentation narrows the set of venues considered safe to interact with, forcing flows into a smaller subset of pools. Together, these dynamics significantly increase the likelihood that a localized disturbance escalates into a broader depegging event.
Experiment Snapshot (December Sample)
Scope
~1,000 stablecoin contracts across Ethereum, Arbitrum, Base, BSC, Polygon, and Optimism, sourced from combined stablecoin lists curated via Dune and Allium.
Data Sources
- Etherscan: token metadata (name, symbol, decimals, total supply) and top holders
- Webacy API: per-address risk scores, structured flags, and issue tags
Method
For each token, we sampled top holders, normalized balances, applied holder-level risk classification logic, and computed contaminated address % and contaminated supply %.
Methodology note: The metrics and classifications in this report are designed to assess risk concentration and structural exposure, not to attribute intent or wrongdoing. Results should be interpreted as indicators of potential liquidity, compliance, and market-structure risk rather than determinations of illicit activity.
What Constitutes “Contamination”
A holder is classified as risky if any of the following conditions are met:
- Webacy risk score thresholds
- overallRisk ≥ 40 (medium risk)
- overallRisk ≥ 80 (high risk)
- overallRisk = 100 (critical risk)
- Structured boolean flags found in Webacy’s API:
Including, but not limited to: ofac_sanctioned, sanctioned, open_sanctions, dprk, hack, drainer, mixers, tornado, automated_trading, and fund-flow indicators tied to illicit activity.
Issue tags indicating high-risk or abusive behavior patterns Explicit tags containing keywords such as: sanction/OFAC, mixer/Tornado, drainer, phishing, hack, exploit, scam, or fraud.
Contamination Metrics
For each token (over the filtered holder set), we compute:
- Contaminated address %: percentage of analyzed holders classified as risky.
- Contaminated supply %: percentage of total token supply held by those risky holders.
These metrics are designed to be:
- comparable across tokens,
- interpretable for compliance and risk teams, and
- sensitive to concentration effects.
How to Read Contamination Metrics
Interpreting stablecoin contamination requires looking at address-level and supply-level signals together:
- High address % + high supply % → broad ecosystem risk driven by many risky holders.
- Low address % + high supply % → concentration or whale-driven risk, where a small cohort controls most supply.
- High all-holders %, low EOA-only % → protocol or liquidity-infrastructure effects (AMMs, routers, vaults).
High EOA-only % → genuine holder-level risk that persists beyond contract artifacts.
Key Findings
Chain-Level Patterns
Base
Contamination on Base is largely driven by automation and phishing-adjacent clusters. Several tokens exhibit concentrated groups of ≥80 and =100 risk holders, with risk primarily stemming from automated trading behavior rather than sanctions exposure.
Ethereum
Multiple Ethereum-based tokens show high contaminated supply percentages despite relatively modest contaminated address percentages. In many cases, this reflects concentration among protocol contracts, AMMs, or routing infrastructure, rather than broad retail holder exposure.
BSC
Automation remains prevalent on BSC, alongside occasional adjacency to mixers or sanctions-related activity.
Arbitrum
A smaller number of tokens on Arbitrum show direct OFAC or Tornado Cash adjacency, indicating closer proximity to policy-relevant risk vectors.
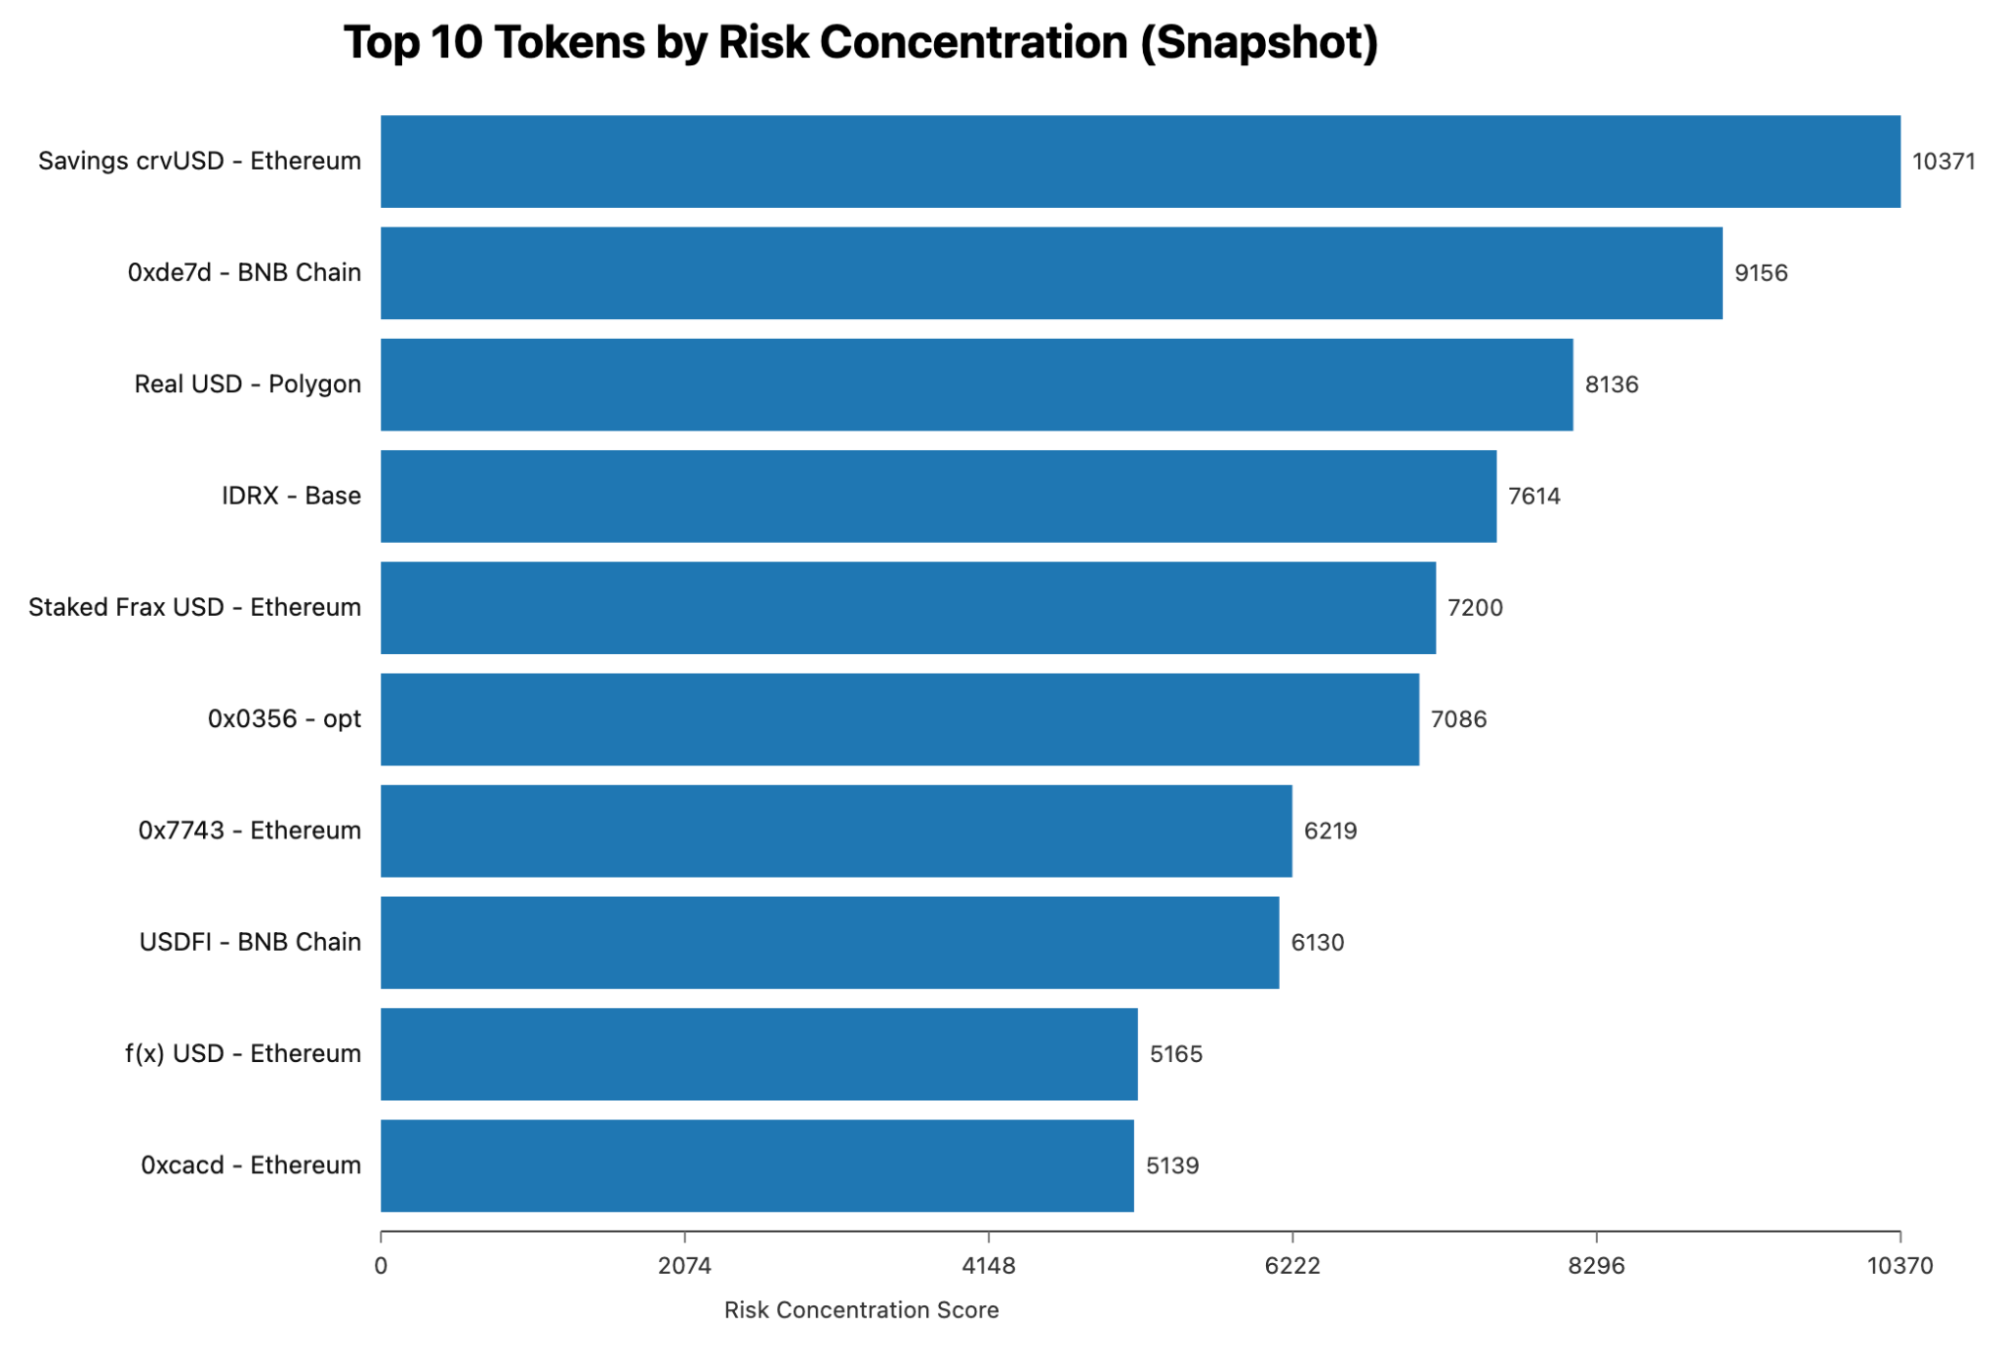
What Risk Concentration Reflects in Practice
Tokens ranked as having high risk concentration are identified based on clustering of critical (=100) and high (≥80) risk holders, combined with severity-weighted risk indicators. In the context of stablecoins, these indicators should be interpreted as signals of concentration, coordination, governance, and market structure, rather than assertions of speculative intent or illicit behavior.
Behavioral and Coordination Signals
These indicators describe how holders interact with the token and with each other, and are often the most directly linked to liquidity stress and depegging risk. Key signals include automated trading and coordinated activity, such as bot-driven accumulation or synchronized behavior; adjacency to phishing, drainer, hack, or theft activity, where exposure reflects elevated counterparty or operational risk; and dense clustering of high-risk holders, particularly around issuance, liquidity events, or periods of market stress.
Caveats and Interpretation
Contract-Holder Effect
AMMs, routers, and vaults are frequently flagged and can inflate contamination metrics. Results are best interpreted when presented using both all-holder and EOA-only views.
Label Coverage
Etherscan address tags are ETH-only, which limits consistent cross-chain attribution.
Sampling Limitations
Top-holder sampling may miss tail risks among smaller holders.
Outlier Validation
Certain anomalous contaminated supply readings require post-hoc verification before drawing strong conclusions.
Risk Concentration Highlights:
scrvUSD: Ethereum
scrvUSD (Ethereum) serves as a clear example of behavioral risk that is largely decoupled from sanctions exposure. It ranks highest in our risk concentration scoring (≈22.9k), driven by dense clusters of high-risk holders (22 at =100 risk, 34 at ≥80) and a large volume of observed behavioral issues (≈254 Webacy “issues”), alongside clear signs of automation (16 automated_trading flags). Notably, we see no meaningful sanctions or mixer adjacency in our runs. From a contamination perspective, the all-holders view shows roughly 41.7% of holders controlling 55.9% of supply flagged as risky. Applying an EOA-only lens reduces that exposure to about 33.6% of holders and 35.6% of supply, indicating that protocol contracts (AMMs, routers, vaults) account for part but not all of the risk. Put simply, scrvUSD’s risk profile is shaped less by policy violations and more by concentrated, automation-heavy participation, a structure that can meaningfully amplify liquidity stress even in the absence of explicit sanctions exposure.
USDEX: BNB Chain
USDEX on BNB Chain is a classic example of extreme supply concentration driving risk, rather than widespread high-risk participation. In the latest snapshot, nearly 100% of the circulating supply is held by holders classified as risky, while address contamination is only ~35%. That asymmetry is the key insight: a small, high-risk cohort controls almost the entire supply. In practical terms, this means that even limited coordinated behavior such as LP withdrawals, bridge movements, or automated selling can transmit shocks very quickly. The risk here is less about broad ecosystem contamination and more about single-point or few-point failure, where actions by a handful of dominant EOAs (or protocol-linked wallets) can materially impact liquidity and price stability. From a monitoring standpoint, the priority should be tracking those top supply holders, with alerts on LP pulls, bridge flows, and synchronized balance changes, as these are the most likely catalysts for rapid stress propagation.
mTBILL: Ethereum
mTBILL (Ethereum) represents one of the clearest examples of genuine supply-side concentration risk in the dataset. It exhibits near-total supply contamination, and crucially, this exposure remains extreme even under an EOA-only view, ruling out a simple explanation driven by AMMs or routing infrastructure. At the same time, address-level contamination is only moderate, indicating that a small number of EOA “whales” control the majority of the circulating supply. This concentration creates a very direct stress channel: actions by a handful of large holders, including redemptions, liquidity withdrawals, or coordinated selling, can materially impact market stability. Paired with scrvUSD, which highlights automation and coordination risk, mTBILL illustrates a complementary failure mode: not bots or infrastructure, but whale-driven concentration as a primary source of depegging and liquidity risk.
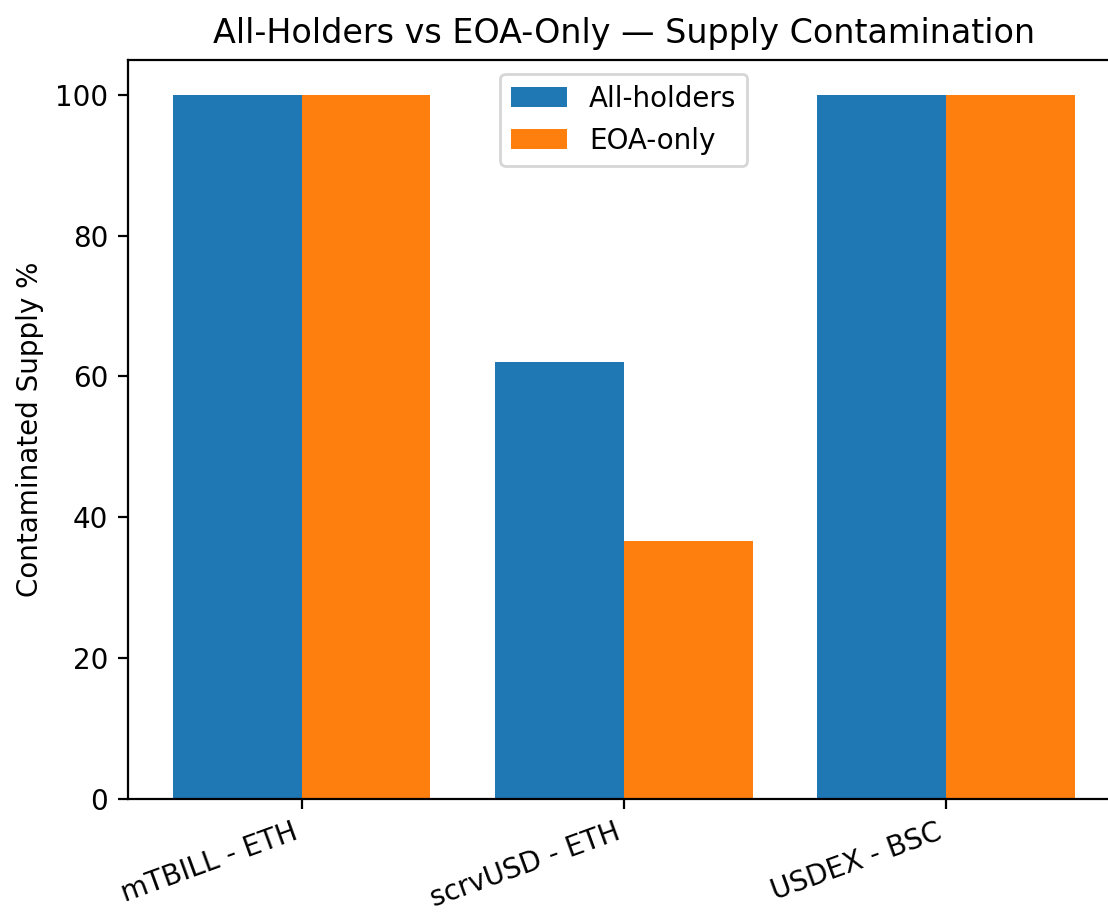
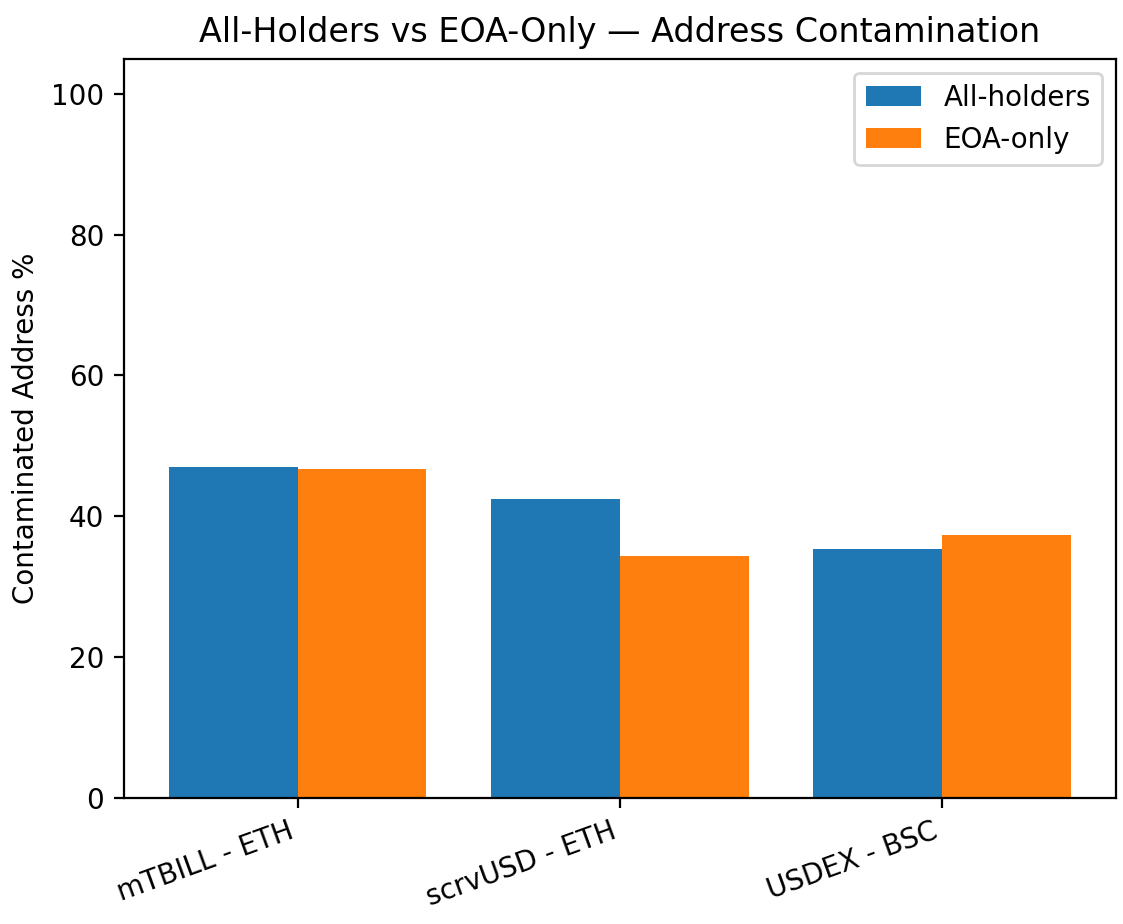
Interpreting the All-Holders vs EOA-Only Views
Figures B and C show how contamination metrics change once protocol infrastructure is separated from externally owned accounts (EOAs). The supply-weighted view (Figure B) highlights where economic risk is actually concentrated, while the address-level view (Figure C) provides context on how broadly that risk is distributed across holders.
Two clear patterns emerge. For mTBILL (Ethereum), near-total supply contamination persists under both all-holders and EOA-only views. This indicates that concentration risk is driven primarily by EOA whales, rather than AMMs or routing infrastructure, pointing to a genuine supply-side stress channel where actions by a small number of large holders could materially affect liquidity and price stability.
scrvUSD (Ethereum) exhibits a different profile. Supply contamination is elevated in the all-holders view but drops meaningfully under the EOA-only lens. This suggests that while some of the observed risk is attributable to protocol infrastructure, a material share remains at the EOA level, consistent with the behavioral and automation-driven clustering observed elsewhere in the analysis.
USDEX (BNB Chain) illustrates a classic concentration asymmetry. Address contamination is relatively modest, yet supply contamination remains effectively total in both views. This pattern indicates that a small cohort of EOAs controls nearly all circulating supply, leaving the ecosystem highly sensitive to coordinated actions such as LP withdrawals, bridge flows, or automated selling.
Taken together, these charts underscore why supply-weighted, EOA-aware analysis is essential for interpreting stablecoin risk accurately. Address counts alone can understate or mischaracterize risk, while all-holders views without EOA separation can overstate it. Evaluating both dimensions together provides a clearer view of which stablecoins face genuine holder-driven risk versus infrastructure-driven artifacts.
Key Takeaways
Stablecoin contamination is best understood as a composite of who holds supply, how those holders behave, and how concentrated that supply is within each ecosystem. While sanctions and mixer adjacency remain important signals, much of the risk observed in practice is driven by market structure dynamics including automation, coordination, and whale level concentration. Applying high veracity labeling and EOA aware analysis helps separate infrastructure effects from genuine holder risk, providing a more reliable and actionable foundation for compliance triage, liquidity risk management, and early detection of depegging risk.
Closing Summary
This analysis shows that stablecoin risk is not just about sanctions or explicit illicit activity. In practice, risk is often driven by market structure. Across chains, a small number of holders, automated strategies, or closely coordinated accounts tend to control a meaningful share of supply. When markets come under stress, this concentration can accelerate liquidity withdrawals and increase the likelihood of depegging.
Looking at both contaminated address share and contaminated supply, while separating EOAs from protocol infrastructure, provides a clearer view of where risk actually sits. It helps distinguish real holder-driven exposure from contract-level noise and highlights which stablecoins are most sensitive to coordinated behavior.
Webacy will continue developing this contamination monitoring system alongside our depegging risk detection and monitoring framework. Together, these tools are designed to provide earlier signals, better context, and more actionable insight into stablecoin stability. More research and findings will follow.