From the CTO’s Desk – January 2026: Webacy’s Stablecoin Depeg Risk Monitor
Author: Jeremiah O'Connor
FX-Aware Scoring, Volatility Detection, and Multi-Source Pricing
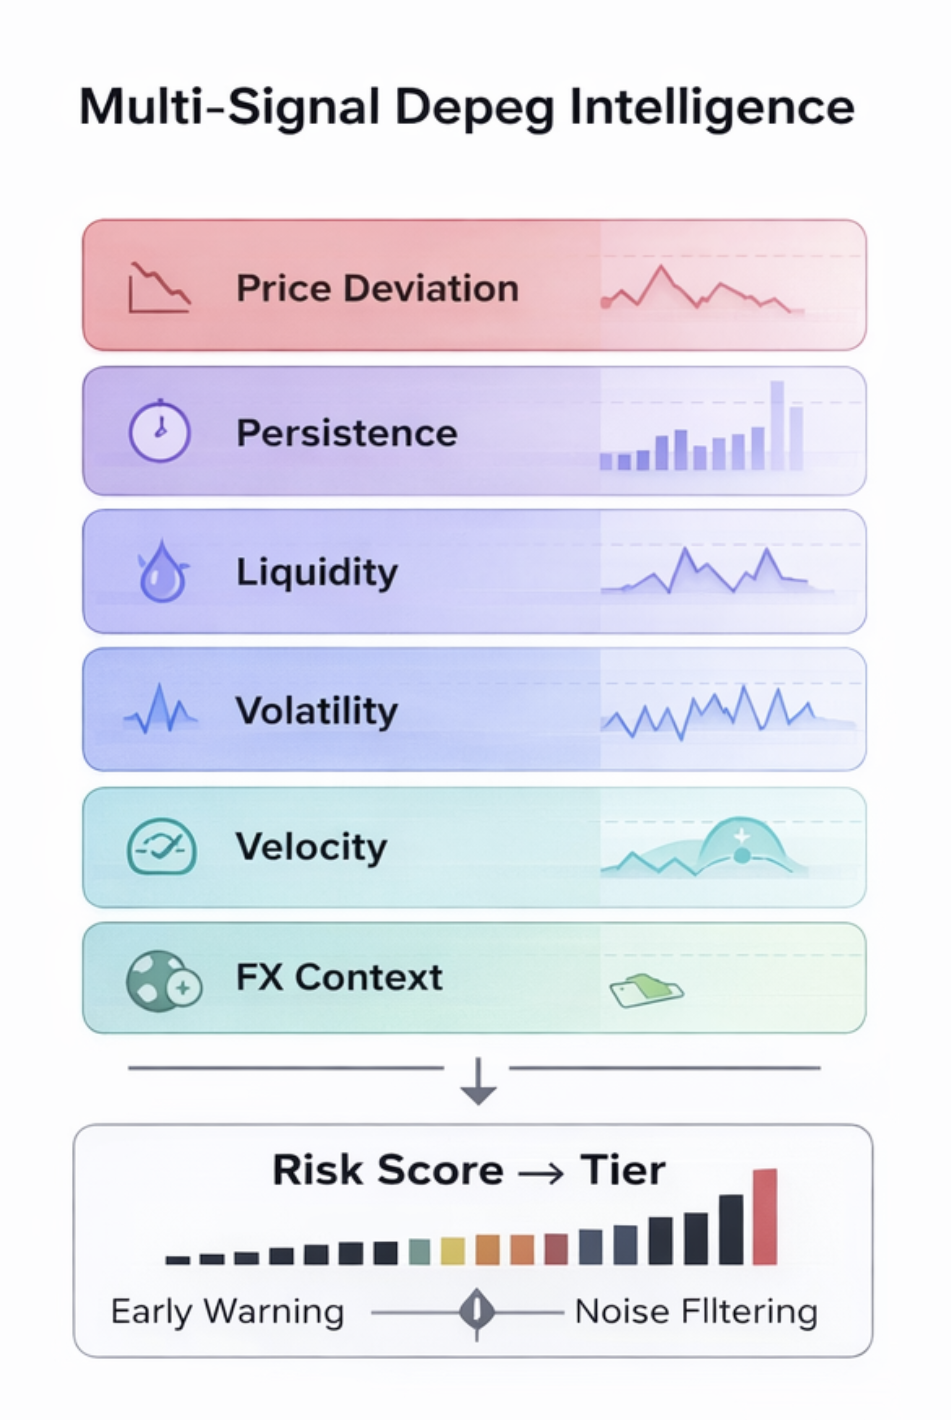
Stablecoin depegging risk is rarely about a single price tick. It’s about what a token is pegged to, how long deviations persist, whether liquidity can absorb stress, how fast conditions are changing, and broader ecosystem signals like contamination and public sentiment.
Getting that right starts with the inputs. This work builds on high-quality on-chain data from Allium, giving us consistent, chain-aware views of prices, liquidity, and activity across the ecosystem. From there, the focus shifts to interpretation: separating noise from real stress as conditions evolve.
In December, we shared how contamination risk can layer with depegging risk to create structural stress across the stablecoin ecosystem. Building on that foundation, this month we focused on a monitoring system designed to see risk earlier and more accurately, one that understands context, noise, and real stress.
Today, we’re excited to publicly launch Webacy’s Depeg Risk Monitor. It’s a real-time depegging risk intelligence system that combines FX-aware scoring, volatility detection, velocity-based escalation, and multi-source price validation. This isn’t a simple price-deviation alert. It’s an integrated, production-proven model for surfacing meaningful risk before it becomes a crisis.
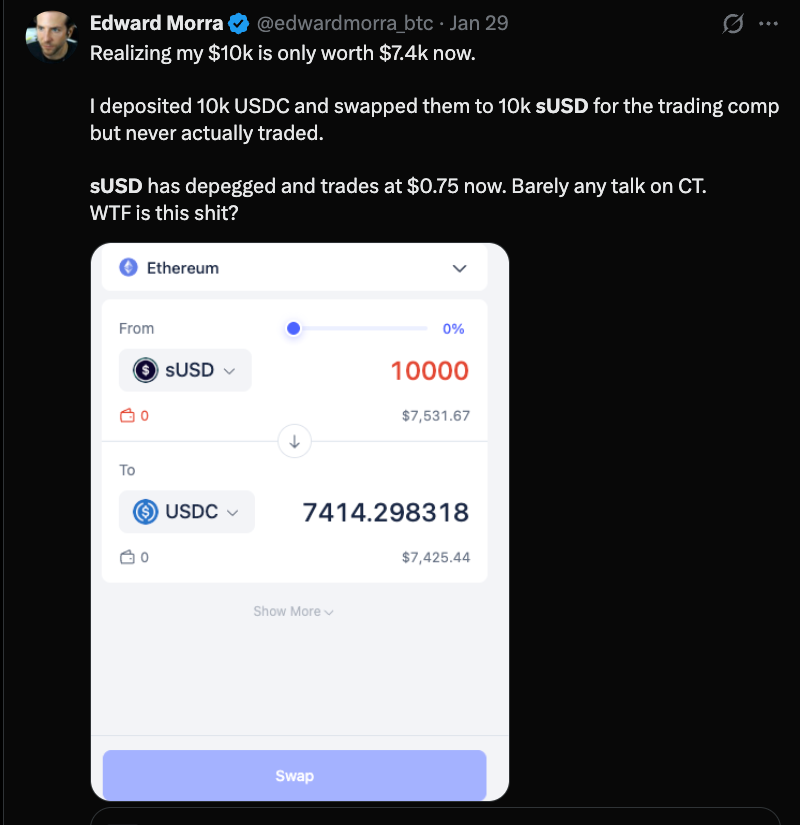
Most importantly, it has already worked in the wild. In late January, the monitor successfully detected the sUSD Synthetix depeg, flagging elevated risk as volatility spiked and price fell toward ~$0.75, giving users advance warning before the situation fully developed.
In the sections below, we explain what we shipped, how it works, and why it matters.
Seeing Risk in Context: FX-Aware Depegging
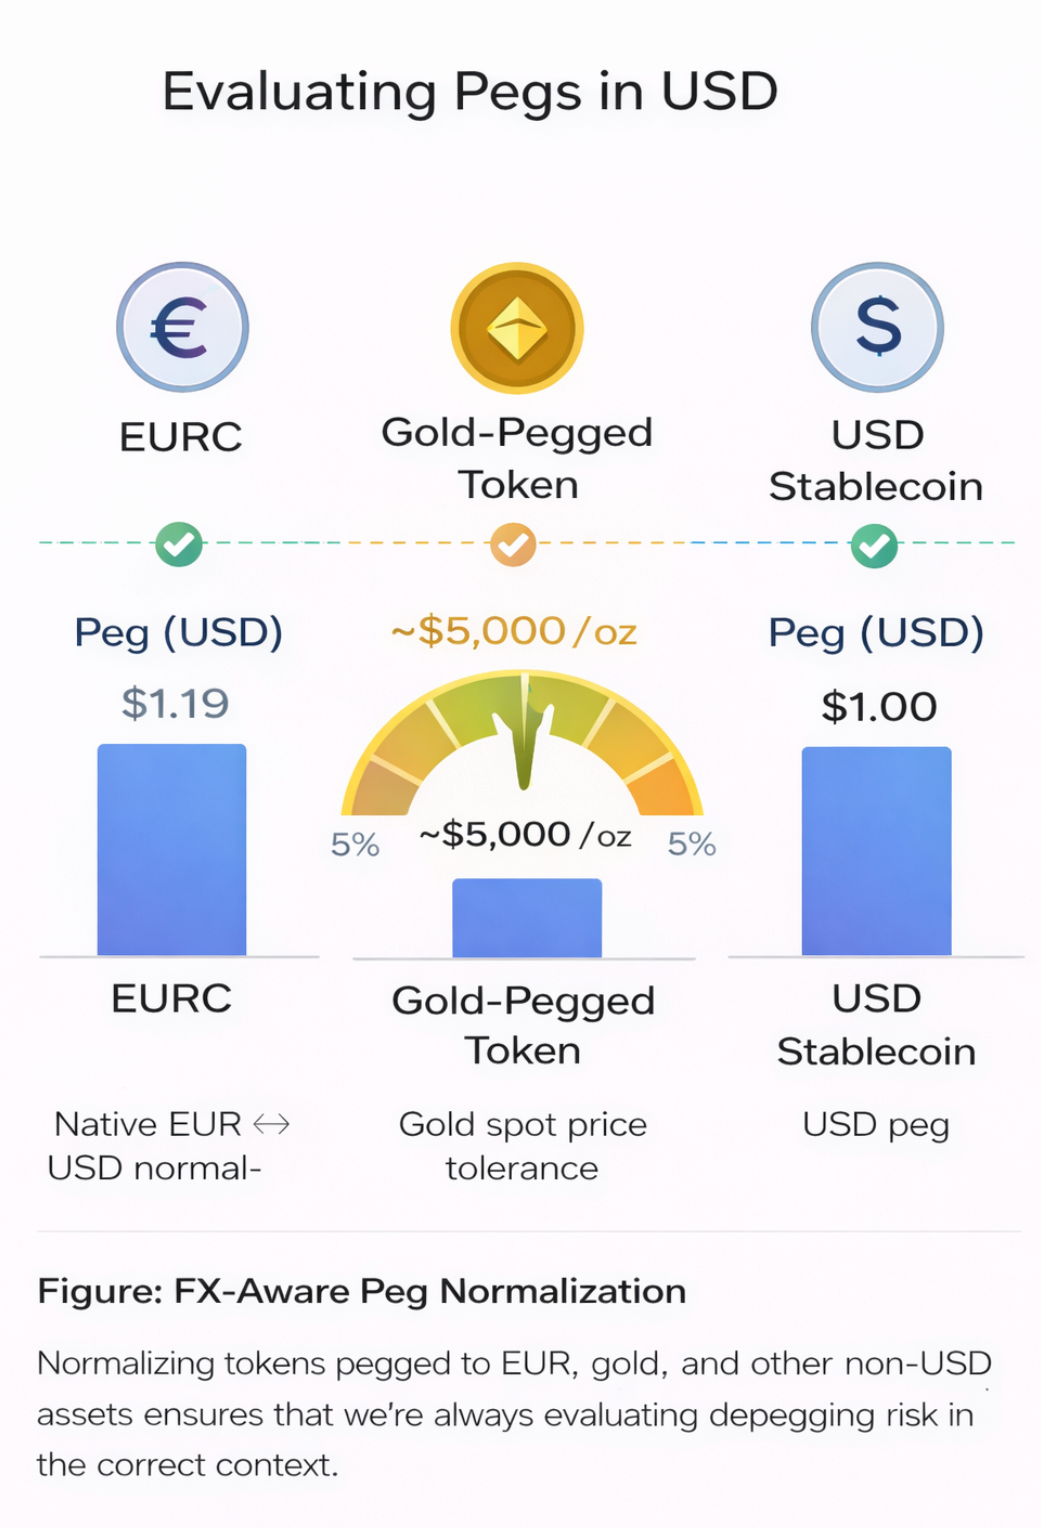
Stablecoins and real-world assets are pegged to many different references, not just USD. Supporting that diversity means understanding the true peg behind each asset and evaluating risk in the right context.
The Depeg Risk Monitor is built to do exactly that:
- Native FX normalization for non-USD pegs including EUR, JPY, GBP, BRL, ZAR, COP, and others
- Gold (XAU) peg support with a 5% spread tolerance that reflects real-world spot price variation
- A clear “Peg (USD)” reference surfaced consistently across dashboards and APIs
By evaluating each token against its actual peg, the system produces cleaner signals and more meaningful alerts across stablecoins and real-world–backed assets, without overreacting to expected market behavior.
Data You Can Trust: Multi-Source Price Consensus
One of the biggest sources of noise in depeg detection is simply getting the price wrong. Thin liquidity, stale feeds, and mispriced pools can all distort signals if taken at face value.
To reduce that risk, the Depeg Risk Monitor cross-checks prices across multiple independent sources:
- DeFiLlama: Primary aggregated DEX pricing across chains
- CoinGecko: Fallback aggregated pricing across centralized and decentralized markets
- DEXScreener: Real-time validation from the highest-liquidity DEX pools
- Bitquery: On-chain VWAP from executed DEX trades, used as ground truth
- 0x API: Executable swap quotes with slippage estimates
In practice:
- When sources agree within 10%, confidence is high
- When they diverge by more than 5%, the system flags a discrepancy
- When a price deviates more than 50% from consensus, the system falls back to the consensus price and marks it with an indicator
This approach avoids over-reliance on any single feed and filters out low-liquidity noise and bad data, while keeping uncertainty visible rather than hidden.
Data Source Transparency
To make price confidence explicit rather than implicit, the dashboard now surfaces data provenance directly alongside each price:
- 🦙 DeFiLlama: Aggregated DEX pricing
- 🦎 CoinGecko: Aggregated CEX and DEX pricing
- 📊 DEXScreener: Real-time prices from high-liquidity DEX pools
- ⛓️ Bitquery: On-chain VWAP derived from executed trades
- 📡 External API: No viable DEX routes available
- 🔄 Price corrected: Original price deviated more than 50% from consensus
- ⚠️ Source disagreement: Significant variance across sources
This transparency helps users quickly assess data provenance and confidence, rather than treating all prices as equal.
Important caveat: These prices are aggregated or averaged signals, not executable quotes. Actual execution depends on real-time liquidity pool state and trade size. For thinly traded or heavily depegged assets, users should always verify directly against on-chain liquidity.
Detecting Stress Before It Breaks: Volatility Burst Signals
Depegs don’t always start with a sudden price break. More often, they begin with rising volatility. Instead of waiting for large deviations, the system tracks rolling volatility and flags sudden bursts that can signal stress early:
- Short-term volatility measured over a 5-minute window
- Baseline volatility measured over the prior 60 minutes
- A volatility burst when short-term volatility exceeds 3× the baseline
These bursts feed directly into risk scoring, surfacing emerging stress before hard thresholds are crossed. Combined with other signals, they help distinguish real structural pressure from temporary market noise.
Velocity & Momentum-Based Scoring
Static thresholds miss fast-moving events. Beyond absolute risk levels, the system tracks how quickly conditions are changing:
- Velocity: how fast the risk score is moving
- Acceleration: whether that movement is speeding up
- Momentum boosts: up to +15 points for rapidly escalating situation
A token moving from 30 to 50 to 65 in minutes is treated more urgently than one sitting steadily at 65. This allows risk to escalate based on trajectory, not just where it happens to land.
Replayable Events: See Risk Evolve
Understanding that a depeg happened isn’t enough. It’s just as important to see how it unfolded. The platform includes replayable historical events with:
- Minute-resolution time series
- Interactive charts for price deviation and risk score
- Coverage of major stress events including SVB/USDC, UST, Curve imbalances, and sUSD (2026)
This makes the system useful not only for live monitoring, but also for post-mortems, audits, and governance reviews.
Smarter Token Classification
Not all “stablecoins” behave the same, and scoring shouldn’t pretend they do. Tokens are categorized with visual badges that directly influence scoring logic:
- Yield-bearing tokens that naturally trade above peg
- RWA-backed tokens with slowly appreciating NAV
- Bridged assets with thinner liquidity and noisier pricing
- Gold-pegged tokens with commodity-aware tolerances
A yield token trading at $1.22 is no longer flagged as “22% depegged.” It’s recognized as normal yield accrual.
Improved Scoring Model
We recalibrated scoring to better separate moderate stress from catastrophic failure:
- Price deviation, liquidity stress, and persistence remain core signals
- Volatility bursts now contribute directly to scoring
- Maximum base risk is reached at a 5% deviation
- Deviations above 20% trigger a catastrophic multiplier
- Yield and RWA assets receive category-aware adjustments so expected premiums don’t inflate risk
Ecosystem Health at a Glance
The dashboard now includes an Ecosystem Health Score (0–100%), summarizing stablecoin conditions across hundreds of monitored assets.
This provides a single, high-level view of whether the ecosystem is healthy, elevated, or stressed, while still allowing teams to drill down into individual drivers.
Documentation & Help
A new “About” page provides comprehensive guidance for interpreting the dashboard, including:
- How risk scores and tiers are calculated
- Column-by-column explanations
- Filter, sorting, and saved view usage
- Data source priority and limitations
- Frequently asked questions
This makes the platform largely self-documenting for new users, partners, and external stakeholders.
Collapsed Projects Page
We maintain a curated list of legitimately collapsed or discontinued stablecoin projects, displayed on a dedicated “Collapsed” page rather than cluttering the main overview.
Examples include:
- Elixir deUSD / sdeUSD — Protocol shutdown
- Zunami USD (UZD) — Exploit (August 2023)
- USDR / wUSDR — Real USD collapse (October 2023)
- flexUSD — CoinFLEX insolvency
- Jarvis jEUR / jCHF — Protocol wound down
These tokens are tracked separately to:
- Keep the main dashboard focused on active projects
- Preserve historical context for failed protocols
- Prevent false alerts from assets with no meaningful liquidity
Real-World Validation: sUSD Depeg (January 2026)
With that foundation in place, we can look at how the system performed during a real depegging event. In late January, the Synthetix sUSD stablecoin experienced a significant depeg. Our system tracked the event live across Ethereum, Optimism, and Arbitrum, capturing both the long-running baseline stress and the sharp acceleration that followed.
Baseline: Chronic Depeg Before the Break
sUSD had already been trading well below peg for several days before conditions worsened. This reflected ongoing structural pressure, not a sudden shock.
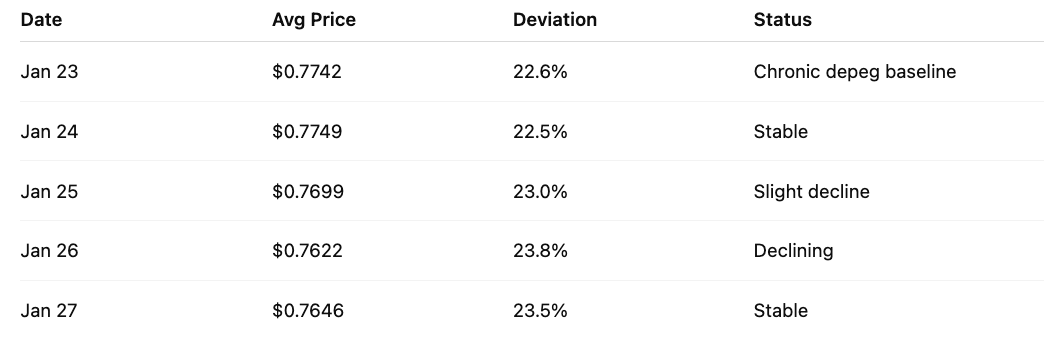
This ~23% discount had effectively become the “new normal” heading into the event.
Acceleration Phase: Conditions Worsen (Jan 28–31)
Starting January 28, stress intensified. Prices continued to fall, volatility picked up, and deviation widened meaningfully beyond the established baseline.
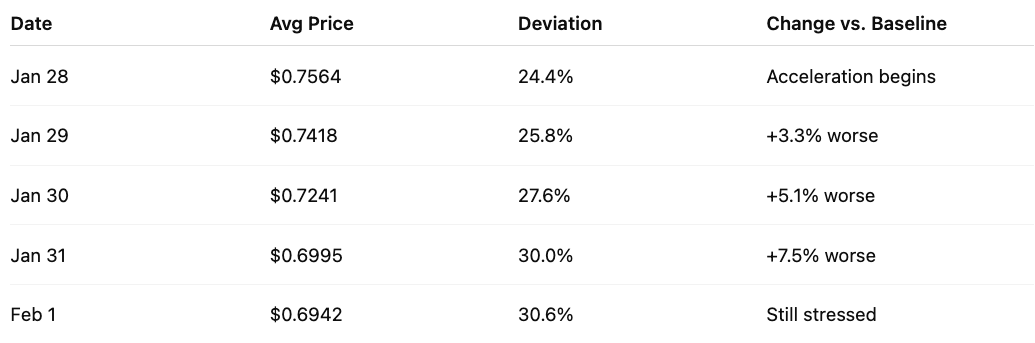
Notable moments:
- Lowest price: ~$0.67 on Jan 31 (~32.7% off peg)
- Highest volatility: Jan 31 afternoon as price fell rapidly
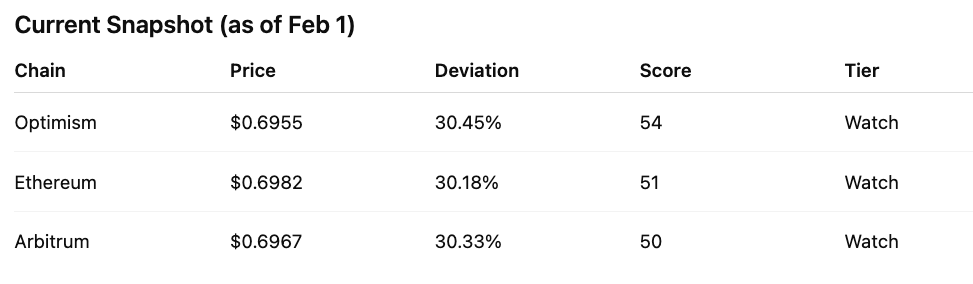
- Cross-chain consistency: Same pattern on Ethereum, Optimism, and Arbitrum
What the System Detected
- Chronic baseline stress tracked continuously
- Acceleration flagged early as deviation pushed beyond ~24%
- Volatility burst detected during the sharp Jan 31 drop
- Persistence scoring captured the multi-day deterioration
- Cross-chain monitoring confirmed consistent stress
- Tier escalation from Watch → Warning on worst-affected chains
Why These Signals Matter
The sUSD depeg highlights two important capabilities:
- Chronic vs. acute stress The system tracked the persistent ~23% baseline discount and detected when conditions began to meaningfully worsen.
- Trajectory over thresholds This wasn’t a flash crash. It unfolded over several days. Velocity and persistence scoring surfaced the risk as it accelerated, rather than waiting for a single hard threshold.
This was live detection under real market stress, not a backtest, and the system behaved exactly as designed.
Conclusion: Why This Matters
Stablecoin depegging risk is rarely about price alone. It’s the combination of currency context, persistence, liquidity, volatility, and velocity, alongside broader ecosystem signals. That context matters more than ever as stablecoins move to the center of on-chain liquidity, payments, and real-world assets. As the number of stablecoins and peg types grows, so does the risk surface, and depegs can quickly propagate across protocols and chains.
This work focused on surfacing those risks earlier and more accurately. By building an FX-aware, multi-signal monitoring system that is resilient to bad data and sensitive to how stress actually develops, we move beyond simple price alerts toward early-warning infrastructure.
The sUSD depeg in late January validated this approach in production. The system tracked baseline stress, detected acceleration, flagged volatility spikes, and escalated risk based on trajectory rather than static thresholds. This was live detection under real market conditions.
As stablecoins scale, depegging monitoring becomes infrastructure. The goal is to surface real risk early, in context, and with enough clarity to act, reducing noise while catching stress before it becomes systemic.
About Webacy
Webacy provides real-time, context-aware risk intelligence for digital assets, helping teams build and operate safer on-chain systems. We work with stablecoin issuers, infrastructure providers, and institutions to monitor depegging risk, liquidity stress, contamination, and behavioral signals across chains, delivering production-grade dashboards and APIs that surface meaningful risk early and support informed decisions as systems scale.